
Introduction:
A small square of firm leather mostly found attached to the bridle at the side of horse’s head is known to many of us as blinkers (aka blinders). The blinkers are used in order to reduce the vision of the horse’s (as they can get 360-degree view) so that it remains focused on its target or goal or destination. However, the trade-off is that the horse is blind to what is happening around him as his vision has been limited with that of a blinker. Read More
In the world of investment, “home bias” is a blinker that most investor’s wear as they tend to generally focus on investing their entire corpus into the domestic equity market. Home biasness refers to tendency to stick with something they are familiar with. In context of India, it implies investing in domestic Indian equity market. While the home run scored by Indian equity stocks have been phenomenal on an absolute basis. The evidence of home biasness exist across the globe and the phenomenon is not only limited to Indian Investors. However, the global investors have started diversifying it. For instance, U.S. investor’s average allocation to US stocks are 70%** whereas Indian investor’s average allocation to Indian stocks are close to 100%***.
While India is one of the fastest growing economies of the world, it still represents merely 3% of the Gross Domestic Product (GDP) of the world (2019) and around 3% of total world stock market capitalization (2018). This data intuitively indicates that there exist potential opportunities for Indian investor to capture the piece of business which are not part of the Indian economy universe or ecosystem. Further in today’s world of globalization, in which Indian investors are already a consumer of several global companies, such businesses represent a prospect of being part of his/her investment portfolio.
Exhibit 1: Gross Domestic Product (GDP) and Total World Stock Market Capitalization
| Country | GDP (% share) | Country | Market Cap (% share) |
|---|---|---|---|
| USA | 24% | United States | 44% |
| China | 16% | China | 9% |
| Japan | 6% | Japan | 8% |
| Germany | 4% | Hong Kong, SAR | 6% |
| India | 3% | France | 3% |
| United Kingdom | 3% | India | 3% |
| Other | 43% | Other | 27% |
*Source World Bank Data, GDP data for 2019 and Total market capitalization for 2018
**Charles Schwab Investment Management; Asset allocation for moderate risk investors databank, 2017.
***Based on portfolio of all Indian equity mutual funds schemes
Benefits of investing in global market:
Different geographic market represents different set of investment opportunities for investors. Every geography or region are affected by various distinct factors. For instance, United States excels in innovation whereas Germany excels in engineering. Most of the developed economics are leading in terms of technological advancement whereas the risk for such economies are aging demography and higher input cost. For emerging economies such as China and India, increase in labor force and working population acts as strength as it results in relatively low labor cost vis-à-vis advanced economies. Whereas the challenge for such economies lie in their dependence on import of technology and commodities. Economics of country such as Russia, Middle East etc. are very sensitive to the fall in crude oil and other hydrocarbon products across the globe as these countries have significant proven oil and other hydrocarbon reserves. Since, the strength and weakness of each region differs, the equity markets behave differently for each of the regions.
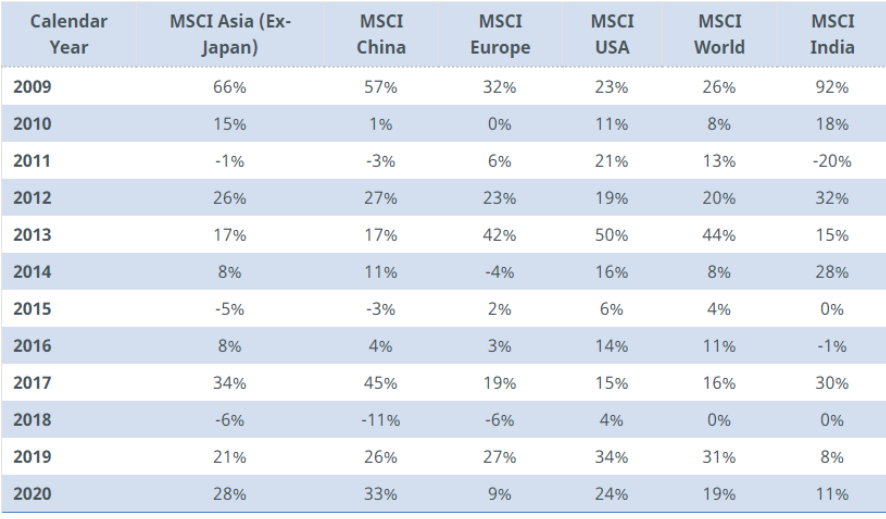
Source: Bloomberg, based on MSCI country Indices (Large cap + Midcap); Asia excludes Japan, all the returns are computed in INR based on INR/USD exchange rate published by Financial Benchmark of India Limited (FBIL)
As demonstrated in the above exhibit, since the Global Financial Crisis (GFC) of 2008, Indian market has been the best performing market in only 4/12 calendar year and has been the worst performing market in 3/12 calendar year. For the same period, the USA market has been best performing in 6/12 calendar year and worst performing market in 3/12 calendar year. This essentially highlights that winners keep on rotating across the geographies and there are no single winners across the globe.
Potential for diversifying country risk
Since the winners across the geographies keep on rotating and the underlying factors affecting various regions are distinct from each other, there exist potential for diversifying one’s country risk exposure. This can be demonstrated in the below table which documents the average correlation among equities market with India (MSCI India) for various calendar year since Global Financial Crisis (GFC) of 2008.
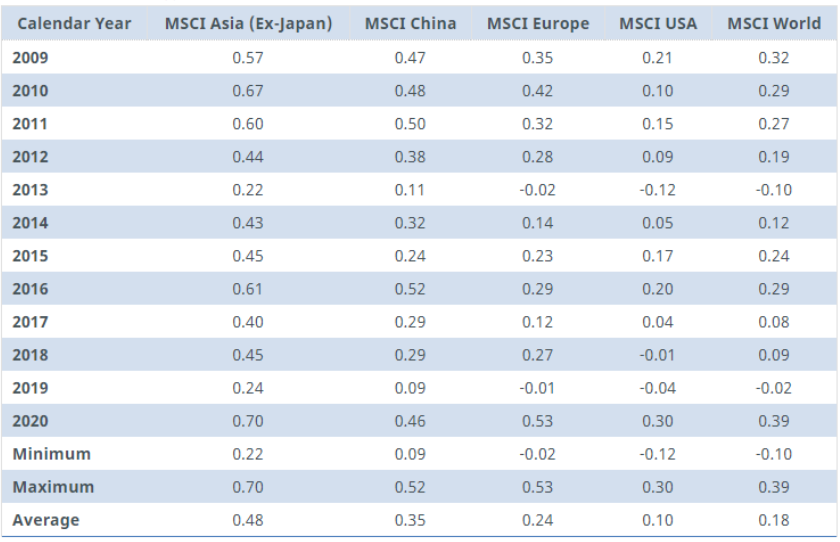
Source: Bloomberg, based on MSCI country Indices (Large cap + Midcap); Asia excludes Japan, all the return is computed in INR based on FBIL INR/USD value. Data from 01st Jan 2009 to 31st Dec 2020 is considered.
The value of correlation ranges from -1 to +1, closer it is to +1.0 the stronger the correlation. Under the exhibit 3 we can see that historically the correlation of Indian equities across the globe has been on the lower side, which indicates potential for diversification. On relative evaluation the correlation with the developed economies such as USA and Europe have been lower than that of China and Asia.
Depreciation of INR adds to the portfolio return
When Indian investor invests in foreign assets he/she is exposed to currency fluctuations. When INR depreciates the value of foreign asset increases and vice-versa. The value of Indian currency generally deprecates against developed economies as the inflation in developed markets tends to be lower than inflation in India.
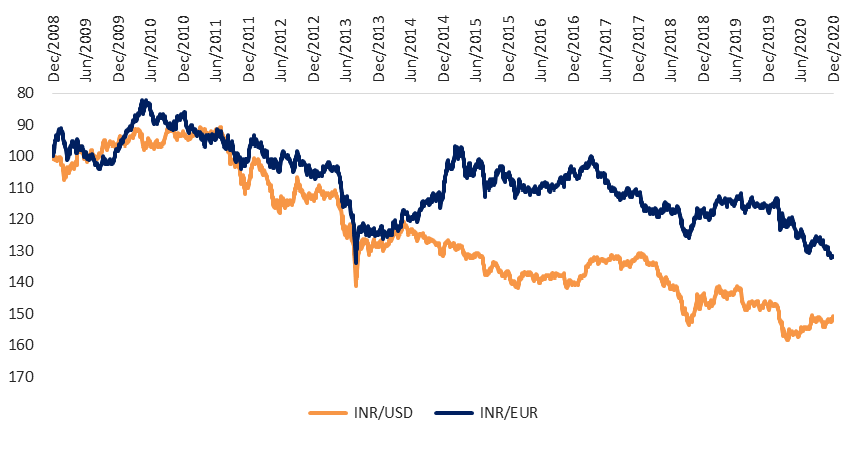
Source: FBIL, historical exchange rate used from 31st Dec 2008 to 31st Dec 2020
Historically post global financial crisis of 2008 till Dec 2020, USD and EUR has appreciated against INR by 3.48% per annum and 2.32% per annum respectively. This means any Indian investor investing in foreign asset denominated in USD and EUR, would have seen his investment appreciated by 3.48% per annum and 2.32% per annum merely due to currency movement.
While in the shorter investment horizon, currency may fluctuate, over longer investment horizon INR has usually depreciated against strong currency such as USD and EUR.
Ability to participate in theme and mega-trends not forming part of India.
While India economy is growing at one of the fastest rates in the world, it is still significantly led by traditional sector companies such as IT consultancy, banking and financial services, petroleum and hydrocarbon and consumer staples. While on the west coast it is technologic centric firms that are shaping the futures.
Further, globally the investors are inclining towards theme that are mega-trend in nature. As defined by Blackrock, “megatrends are powerful, transformative forces that can change the trajectory of the global economy by shifting the priorities of societies, driving innovation and redefining business models. They have a meaningful impact not just on how we live and how we spend money, but also on government policies and corporate strategies”.
Popular themes which are emerging across the globe are robotic and artificial intelligence, electric vehicle, cyber security, industrial automations, cloud computing’s, e-commerce and data center etc. These themes are expected to shape our future in coming times and therefore are making buzz and are increasingly becoming part of global investor’s portfolio.
Since, Indian equities provide avenues of only exposure to old economy themes, one needs to look at global investable universe to participate in such themes and mega-trends that are expected to transform the way we live and work.
Exposure through ADR
American Depository Receipts (ADRs) are stocks that trade on U.S. exchanges but represent shares in a foreign corporation. Many international companies intend to raise capital from United states and rather than going through cumbersome process of listing their own shares, they adopt route of issuance of ADR to the American investors. Investor’s may also prefer dealing and investing through ADR as this mitigates any risk associated with direct investing into foreign market such as restriction of capital flow, taxation jurisdiction issues, political turmoil in the foreign market etc.
Using Exchange Traded Funds (ETFs)/Fund of Funds (FoF) for Global Investment.
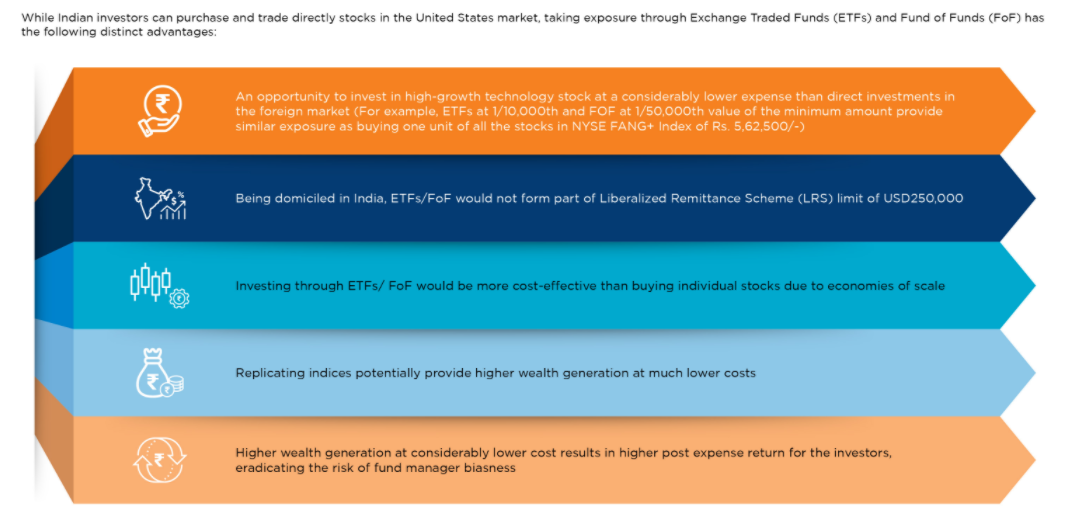
While India is one of the fastest growing economy it still represents a very small part of global GDP and global equity market capitalization. Further, Indian investors cannot take exposure to several themes or emerging mega-trend that are shaping the world by investing only in India. As a result of which Indian investors needs to start evaluating global investment options. Further, empirically it has been demonstrated that no single country equity market has outperformed consistently and winners keep on rotating across the globe. Lower correlation among different equity markets also leads to potential diversification of single country risk. Further, Indian investor have over the long-run benefited from deprecation of Indian Rupees against strong currency such as USD or EUR.
While Indian equity market and Indian economy is still driven by traditional sector or companies such as BFSI, consumer staples, oil and refineries etc., globally technological companies are driving the future and change.
By using Exchange Traded Funds/Fund of Funds to take exposure in US markets. This can have higher advantage than directly buying the stocks and active mutual funds in the foreign market due to lower cost and lower risk.
Articles

Global Investing through ETFs
Even though mutual funds investing in overseas securities have existed in India for more than 10 years, investor awareness about these funds has been low.
Read More