MIRAE ASSET
S&P 500 TOP 50 ETF - (NSE Symbol : MASPTOP50, BSE Code: 543365)
(Exchange Traded Fund (ETF) - An open-ended scheme replicating/tracking S&P 500 Top 50 Total Return Index)
| Type of Scheme | Exchange Traded Fund (ETF) - An open-ended scheme replicating/tracking S&P 500 Top 50 Total Return Index |
| Investment Objective | The investment objective of the scheme is to generate returns, before expenses, that are commensurate with the performance of the S&P 500 Top 50 Total Return Index, subject to tracking error and forex movement. The Scheme does not guarantee or assure any returns. |
Fund Manager** |
Mr. Siddharth Srivastava (since September 20, 2021) |
| Allotment Date | 20th September 2021 |
| Benchmark Index | S&P 500 Top 50 Index (TRI) |
| Minimum Investment Amount |
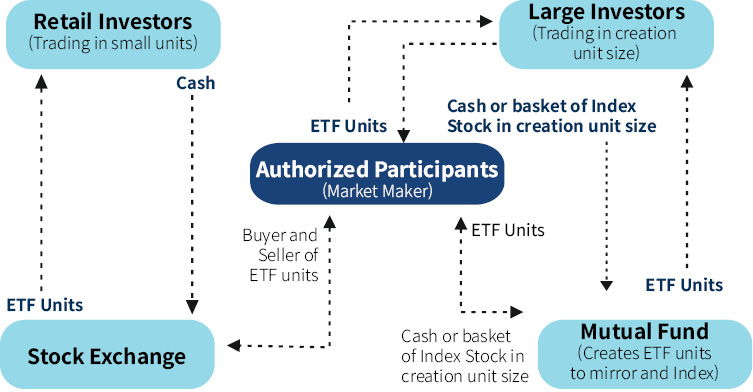
On exchange ( in multiple of 1 units) with in 5 days from the date of allotment. Directly with AMC (in multiple of 5,50,000 units |
Systematic Investment Plan (SIP) (Any Date SIP is available from 1st July, 2019) |
NA |
| Load Structure | Entry load: NA Exit load: For Creation Unit Size: No Exit load will be levied on redemptions made by Authorized Participants / Large Investors directly with the Fund in Creation Unit Size. For other than Creation Unit Size: Not Applicable -The Units of MASPTOP50 in other than Creation Unit Size cannot ordinarily be directly redeemed with the Fund. These Units can be redeemed (sold) on a continuous basis on the Exchange(s) where it is listed during the trading hours on all trading days. |
| Plans Available Options Available |
The Scheme does not offer any Plans/Options for investment |
| Monthly Average AUM (₹ Cr.) as on December 30, 2022 | 502.62 |
| Net AUM (₹ Cr.) | 491.98 |
| 1 Year Tracking Error is ~ | 16.80 bps |
| Monthly Avg. Expense Ratio (Including Statutory Levies) as on December 30, 2022 | 0.59% |
| **For experience of Fund Managers Click Here | |
| ₹ 25.5878 (Per Unit) |
Mirae Asset Capital Markets (India) Private Limited
East India Securities Limited
Kanjalochana Finserve Private Limited
Live iNav is updated on Mirae Asset Mutual Fund website
NSE Symbol : MASPTOP50
BSE Code: 543365
Bloomberg Code: MASPTOP50 IN Equity
Reuters Code: MIRA.NS
| Portfolio Holdings | % Allocation |
| Technology Hardware, Storage & Peripherals | |
| Apple Inc | 11.78% |
| Systems Software | |
| Microsoft Corp | 10.84% |
| Pharmaceuticals | |
| Johnson & Johnson | 2.80% |
| Eli Lilly & Co |
1.75% |
| PFIZER INC | 1.74% |
| Merck & Co. Inc | 1.71% |
| BRISTOL MYERS SQUIBB ORD | 0.93% |
| Interactive Media & Services | |
| Alphabet Inc A | 3.20% |
| Alphabet Inc | 2.85% |
| Meta Platforms Registered Shares A | 1.64% |
| Semiconductors | |
| Nvidia Corp Com | 2.21% |
| Broadcom Inc | 1.37% |
| Texas Instruments Inc | 0.91% |
| QUALCOMM INC | 0.75% |
| INTEL CORP | 0.66% |
| Advanced Micro Devices Inc | 0.63% |
| Diversified Banks | |
| JP Morgan Chase & Co | 2.38% |
| BANK OF AMERICA CORP | 1.40% |
| Wells Fargo & Co | 0.95% |
| Integrated Oil & Gas | |
| Exxon Mobil Corporation Ltd | 2.75% |
| Cheveron Corp | 1.94% |
| Internet & Direct Marketing Retail | |
| Amazon Com Inc | 4.52% |
| Data Processing & Outsourced Services | |
| Visa Inc | 2.06% |
| Mastercard Incorporated | 1.79% |
| Multi-Sector Holdings | |
| Berkshire Hathaway Inc | 3.38% |
| Soft Drinks | |
| PEPSICO INC | 1.51% |
| Coca Cola Co. | 1.50% |
| Managed Health Care | |
| Unitedhealth Group Inc | 3.00% |
| Hypermarkets and Supercenters | |
| Costco Wholesale Corp | 1.23% |
| Walmart Inc | 1.21% |
| Life Sciences Tools & Services | |
| Thermo Fisher Scientific Inc | 1.31% |
| Danaher Corp | 1.05% |
| Household Products | |
| Procter & Gamble Co | 2.18% |
| Automobile Manufacturers | |
| Tesla Inc | 2.00% |
| Home Improvement Retail | |
| Home Depot Inc | 1.96% |
| Integrated Telecommunication Services | |
| Verizon Communications Inc | 1.00% |
| AT&T Inc | 0.80% |
| Health Care Equipment | |
| ABBOTT LABORATORIES | 1.16% |
| Medtronic PLC | 0.63% |
| Application Software | |
| Adobe Inc | 0.95% |
| Salesforce Inc | 0.80% |
| Biotechnology | |
| AbbVie Inc | 1.73% |
| Communications Equipment | |
| CISCO SYS INC COM | 1.19% |
| Restaurants | |
| MCDONALD'S CORPOPRATION | 1.17% |
| IT Consulting & Other Services | |
| Accenture Plc-CL A | 1.02% |
| Industrial Gases | |
| Linde PLC | 0.98% |
| Movies & Entertainment | |
| The Walt Disney Company | 0.96% |
| Tobacco | |
| Philip Morris International Ord | 0.95% |
| Cable & Satellite | |
| Comcast Corp - Class A | 0.91% |
| Footwear | |
| NIKE Inc | 0.89% |
| Railroads | |
| Union Pacific Ord | 0.77% |
| International Equity Holding Total | 99.82% |
| Cash & Other Receivables | 0.18% |
| Total | 100.00% |

| Returns (in%) | ||||
| 1 Yr | SI | |||
| MASPTOP50 | -16.25% |
-5.28% |
||
| Scheme Benchmark* | -15.44% |
-4.38% |
||
| Additional Benchmark** | 5.80% |
3.61% |
||
| NAV as on 30th December, 2022 | ₹ 25.5878 | |||
| Index Value (30th December, 2022) | Index Value of benchmark is 5,061.33 and S&P BSE Sensex (TRI) is 91,969.30 |
|||
| Allotment Date | 20th September, 2021 | |||
| Scheme Benchmark | *S&P 500 Top 50 Index (TRI) | |||
| Additional Benchmark | **S&P BSE Sensex (TRI) | |||
Fund manager : Mr. Siddharth Srivastava managing the scheme since September 20, 2021.
Note: Returns below or for 1 year are absolute returns, returns above 1 year are CAGR- Compounded Annualized Growth returns.
This product is suitable for investors who are seeking*
• Returns that are commensurate with the performance of S&P 500 Top 50 Total Return Index subject to tracking error and foreign exchange movement
• Investments in equity securities covered by S&P 500 Top 50 Total Return Index
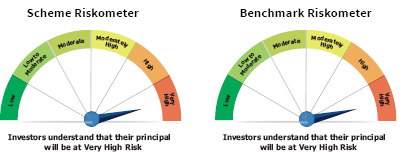
*Investors should consult their financial advisers if they are not clear about the suitability of the product.
Past Performance may or may not be sustained in future.
Note : For computation of since inception returns (%) the allotment NAV has been taken as ₹ 27.418. The performance of other funds managed by the same fund manager is given in the respective page of the schemes 
Different Plans under the scheme has different expense structure. The reference and details provided here in are of Regular Plan - Growth Option