MIRAE ASSET
ARBITRAGE FUND - (MAAF)
(Arbitrage Fund - An open ended scheme investing in arbitrage opportunities)
| Type of Scheme | Arbitrage Fund - An open ended scheme investing in arbitrage opportunities |
| Investment Objective | The investment objective of the scheme is to generate capital appreciation and income by predominantly investing in arbitrage opportunities in the cash and derivative segments of the equity markets and the arbitrage opportunities available within the derivative segment and by investing the balance in debt and money market instruments. There is no assurance or guarantee that the investment objective of the scheme will be realized. |
Fund Manager** |
Mr. Jignesh Rao (Equity portion) (since June 19, 2020), Mr. Jigar Sethia (Equity portion) (since June 19, 2020) & Mr. Mahendra Jajoo (Debt portion) (since June 19, 2020) |
| Allotment Date | 19th June, 2020 |
| Benchmark Index | NIFTY 50 Arbitrage Index |
| Minimum Investment Amount |
₹ 5,000/- and inmultiples of ₹ 1/- thereafter Minimum Additional Application Amount: ₹ 1,000/- per application and inmultiples of ₹ 1/- thereafter. |
Systematic Investment Plan (SIP) (Any Date SIP is available from 1st July, 2019) |
Monthly and Quarterly: ₹ 1,000/- (multiples of ₹ 1/- thereafter), minimum 5 in case of Monthly or 3 in case of Quarterly option. |
| Load Structure | Entry load: NA Exit Load: 0.25% if redeemed or switched out within 30 days from the date of allotment Nil after 30 days |
| Plans Available | Regular Plan and Direct Plan |
| Options Available | Growth Option and IDCW^ Option (Payout & Re-investment) |
| Monthly Average AUM (₹ Cr.) as on December 30, 2022 | 357.55 |
| Net AUM (₹ Cr.) |
329.21 |
| Monthly Avg. Expense Ratio (Including Statutory Levies) as on December 30, 2022 |
Regular Plan: 1.09% Direct Plan: 0.35% |
| **For experience of Fund Managers Click Here | |
| ^Pursuant to Notice cum addendum dated March 27, 2021 the nomenclature of dividend option has been changed w.e.f. April 01, 2021. | |
| NAV: | Direct | Regular |
| Growth | ₹ 11.153 | ₹ 10.959 |
| IDCW^ | ₹ 11.145 | ₹ 10.958 |
| Portfolio Turnover Ratio | 11.31 times |
@The Volatility, Beta, R Squared, Sharpe Ratio & Information Ratio are calculated on returns from last three years Monthly data points. # Risk free rate: FBIL OVERNIGHT MIBOR as on 30th December, 2022. ^Basis last rolling 12 months. |
|
Average Maturity |
0.93 Years |
Modified Duration |
0.89 Years |
Macaulay Duration |
0.92 Years |
Annualized Portfolio YTM* |
6.84% |
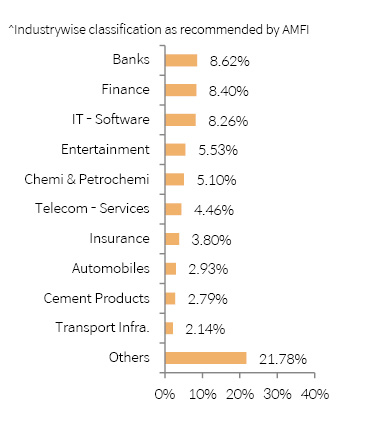
| Portfolio Holdings | % Allocation |
| Banks | |
| Bandhan Bank Ltd | 2.06% |
| HDFC Bank Ltd | 1.82% |
| Axis Bank Ltd | 1.63% |
| ICICI Bank Ltd | 1.61% |
| Kotak Mahindra Bank Ltd | 1.49% |
| Finance | |
| Piramal Enterprises Ltd | 2.19% |
| REC Ltd | 1.67% |
| Bajaj Finserv Ltd | 1.53% |
| Housing Development Finance Corporation Ltd | 1.51% |
| Power Finance Corporation Ltd | 1.46% |
| SBI Cards and Payment Services Ltd | 0.04% |
| IT - Software | |
| Tata Consultancy Services Ltd | 2.75% |
| Infosys Ltd | 2.18% |
| HCL Technologies Ltd | 2.01% |
| Tech Mahindra Ltd | 1.32% |
| Entertainment | |
| Sun TV Network Ltd | 4.35% |
| Zee Entertainment Enterprises Ltd | 1.18% |
| Chemicals & Petrochemicals | |
| Pidilite Industries Ltd | 2.36% |
| SRF Ltd | 1.46% |
| Tata Chemicals Ltd | 1.28% |
| Telecom - Services | |
| Bharti Airtel Ltd | 2.79% |
| Tata Communications Ltd | 1.66% |
| Insurance | |
| Max Financial Services Ltd | 1.73% |
| ICICI Prudential Life Insurance Company Ltd | 1.34% |
| SBI Life Insurance Company Ltd | 0.65% |
| HDFC Life Insurance Company Ltd | 0.09% |
| Automobiles | |
| Maruti Suzuki India Ltd | 1.45% |
| Bajaj Auto Ltd | 1.32% |
| Mahindra & Mahindra Ltd | 0.16% |
| Cement & Cement Products | |
| Ambuja Cements Ltd | 1.63% |
| Dalmia Bharat Ltd | 1.16% |
| Transport Infrastructure | |
| Adani Ports and Special Economic Zone Ltd | 2.14% |
| Industrial Products | |
| Polycab India Ltd | 2.11% |
| Consumer Durables | |
| Titan Company Ltd | 2.01% |
| Non - Ferrous Metals | |
| Hindalco Industries Ltd | 1.75% |
| National Aluminium Company Ltd | 0.26% |
| Healthcare Services | |
| Syngene International Ltd | 1.99% |
| Fertilizers & Agrochemicals | |
| UPL Ltd | 1.67% |
| Ferrous Metals | |
| Tata Steel Ltd | 1.60% |
| Petroleum Products | |
| Reliance Industries Ltd | 1.55% |
| Diversified FMCG | |
| ITC Ltd | 1.53% |
| Pharmaceuticals & Biotechnology | |
| Cipla Ltd | 1.53% |
| Capital Markets | |
| Multi Commodity Exchange of India Ltd | 1.47% |
| Agricultural Food & other Products | |
| Tata Consumer Products Ltd | 1.43% |
| Beverages | |
| United Spirits Ltd | 1.15% |
| Power | |
| NTPC Ltd | 0.89% |
| Tata Power Company Ltd | 0.17% |
| Aerospace & Defense | |
| Hindustan Aeronautics Ltd | 0.67% |
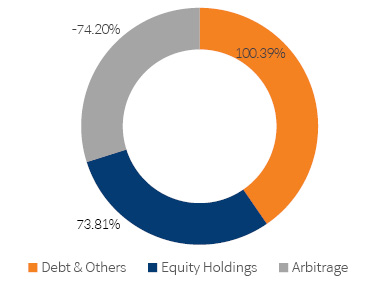
| Equity Holding Total | 73.81% |
| Equity Futures | |
| SBI Cards and Payment Services Ltd January 2023 Future | -0.04% |
| HDFC Life Insurance Company Ltd January 2023 Future | -0.10% |
| Mahindra & Mahindra Ltd January 2023 Future | -0.16% |
| Tata Power Company Ltd January 2023 Future | -0.17% |
| National Aluminium Company Ltd January 2023 Future | -0.26% |
| SBI Life Insurance Company Ltd January 2023 Future | -0.65% |
| Hindustan Aeronautics Ltd January 2023 Future | -0.67% |
| NTPC Ltd January 2023 Future | -0.90% |
| United Spirits Ltd January 2023 Future | -1.16% |
| Dalmia Bharat Ltd January 2023 Future | -1.16% |
| Zee Entertainment Enterprises Ltd January 2023 Future | -1.19% |
| Tata Chemicals Ltd January 2023 Future | -1.29% |
| Tech Mahindra Ltd January 2023 Future | -1.32% |
| Bajaj Auto Ltd January 2023 Future | -1.32% |
| ICICI Prudential Life Insurance Company Ltd January 2023 Future | -1.34% |
| Tata Consumer Products Ltd January 2023 Future | -1.43% |
| Maruti Suzuki India Ltd January 2023 Future | -1.46% |
| Power Finance Corporation Ltd January 2023 Future | -1.47% |
| SRF Ltd January 2023 Future | -1.47% |
| Multi Commodity Exchange of India Ltd January 2023 Future | -1.48% |
| Kotak Mahindra Bank Ltd January 2023 Future | -1.50% |
| Housing Development Finance Corporation Ltd January 2023 Future | -1.53% |
| Bajaj Finserv Ltd January 2023 Future | -1.54% |
| ITC Ltd January 2023 Future | -1.54% |
| Cipla Ltd January 2023 Future | -1.54% |
| Reliance Industries Ltd January 2023 Future | -1.56% |
| Tata Steel Ltd January 2023 Future | -1.61% |
| ICICI Bank Ltd January 2023 Future | -1.62% |
| Axis Bank Ltd January 2023 Future | -1.64% |
| Ambuja Cements Ltd January 2023 Future | -1.64% |
| Tata Communications Ltd January 2023 Future | -1.67% |
| UPL Ltd January 2023 Future | -1.68% |
| REC Ltd January 2023 Future | -1.68% |
| Max Financial Services Ltd January 2023 Future | -1.73% |
| Hindalco Industries Ltd January 2023 Future | -1.76% |
| HDFC Bank Ltd January 2023 Future | -1.83% |
| Syngene International Ltd January 2023 Future | -2.00% |
| HCL Technologies Ltd January 2023 Future | -2.00% |
| Titan Company Ltd January 2023 Future | -2.02% |
| Bandhan Bank Ltd January 2023 Future | -2.08% |
| Polycab India Ltd January 2023 Future | -2.12% |
| Adani Ports and Special Economic Zone Ltd January 2023 Future | -2.16% |
| Infosys Ltd January 2023 Future | -2.19% |
| Piramal Enterprises Ltd January 2023 Future | -2.20% |
| Pidilite Industries Ltd January 2023 Future | -2.38% |
| Tata Consultancy Services Ltd January 2023 Future | -2.76% |
| Bharti Airtel Ltd January 2023 Future | -2.81% |
| Sun TV Network Ltd January 2023 Future | -4.37% |
| Equity Futures Total | -74.20% |
| Treasury Bill | |
| 364 Days Tbill (01/06/2023) | 2.96% |
| 364 Days Tbill (15/06/2023) | 1.47% |
| 364 Days Tbill (22/06/2023) | 1.47% |
| 364 Days Tbill (17/08/2023) | 1.46% |
| 364 Days Tbill (14/09/2023) | 1.45% |
| 364 Days Tbill (28/09/2023) | 1.45% |
| 364 Days Tbill (12/10/2023) | 1.44% |
| Treasury Bill Total | 11.70% |
| Government Bond | |
| 6.84% GOI (19/12/2022) | 4.49% |
| Government Bond Total | 4.49% |
| Cash & Other Receivables Total | 84.20% |
| Total | 100.00% |
| Returns (in%) | ||||
| 1 Yr | SI | |||
| MAAF | 4.10% |
3.68% |
||
| Scheme Benchmark* | 4.19% |
3.73% |
||
| Additional Benchmark** | 4.11% |
3.79% |
||
| NAV as on 30th December, 2022 | ₹ 10.959 | |||
| Index Value (30th December, 2022) | Index Value of Scheme benchmark is 2,088.29 and CRISIL 1 Year T-Bill is 6,518.86 |
|||
| Allotment Date | 19th June, 2020 | |||
| Scheme Benchmark | *Nifty 50 Arbitrage Index | |||
| Additional Benchmark | **CRISIL 1 Year T-Bill | |||
Fund manager : Mr. Jignesh Rao (since June 19, 2020), Mr. Jigar Sethia (since June 19, 2020) and Mr. Mahendra Jajoo (Debt Portion) (since June 19, 2020)
Note: Returns below or for 1 year are absolute returns, returns above 1 year are CAGR- Compounded Annualized Growth returns.
| Period | Total Amount Invested | Mkt Value as on 30-December-2022 |
SI |
300,000 |
315,426 |
1 Yr |
120,000 |
122,881 |
Returns (%) |
Period |
|
SI |
1yr |
|
Fund Return& (%) |
3.94 |
4.50 |
Benchmark Return& (%) |
4.14 |
4.48 |
Add. Benchmark Return& (%) |
3.99 |
4.79 |
& The SIP returns are calculated by XIRR approach assuming investment of ₹ 10,000/- on the 1st working day of every month.
This product is suitable for investors who are seeking*
• Income over short term
• Investments predominantly in arbitrage opportunities in the cash and derivative segments and the arbitrage opportunities available within the derivative segment
*Investors should consult their financial advisers if they are not clear about the suitability of the product.
Past Performance may or may not be sustained in future.
Note : For computation of since inception returns (%) the allotment NAV has been taken as ₹ 10.00. The performance of other funds managed by the same fund manager is given in the respective page of the schemes and on 
Different Plans under the scheme has different expense structure. The reference and details provided here in are of Regular Plan - Growth Option