MIRAE ASSET
TAX SAVER FUND - (MATSF)
(ELSS - An open ended equity linked saving scheme with a statutory lock in of 3 years and tax benefit)
| Type of Scheme | ELSS - An open ended equity linked saving scheme with a statutory lock in of 3 years and tax benefit |
| Investment Objective | The investment objective of the scheme is to generate long-term capital appreciation from a diversified portfolio of predominantly equity and equity related instruments. The Scheme does not guarantee or assure any returns |
| Fund Manager** | Mr. Neelesh Surana (since inception) |
| Allotment Date | 28th December, 2015 |
| Benchmark Index | NIFTY 200 (TRI)* |
| Minimum Investment Amount |
₹500/- and in multiples of ₹500/- thereafter |
Systematic Investment Plan (SIP) (Any Date SIP is available from 1st July, 2019) |
Minimum installment of ₹500/- (monthly / quarterly frequency) and in multiples of ₹500/- thereafter. |
| Load Structure | Entry Load:NA Exit Load: NIL |
| Plans Available | Regular Plan and Direct Plan |
| Options Available | Growth Option and Dividend Option For Mirae Asset Tax Saver Fund only growth and dividend payout option are available. |
| Monthly Average AUM (₹ Cr.) as on August 31, 2020 | 4,079.95 |
| Net AUM (₹ Cr.) | 4,181.07 |
| Monthly Avg. Expense Ratio (Including Statutory Levies) as on August 31, 2020 |
Regular Plan: 1.90% Direct Plan: 0.41% |
| ANY DATE SIP provides one of the better investment experiences by allowing the investor to choose any investment date of the month (i.e., from 1st to 28th) depending upon the investors' expense and income flow. | |
| *S&P BSE 200 (TRI) has been changed to NIFTY 200 (TRI), w.e.f 30th April 2019. Please refer addendum dated 26th April 2019. | |
| **For experience of Fund Managers Click Here | |
| NAV: | Direct Plan | Regular Plan |
| Growth Option | ₹ 20.186 | ₹ 18.868 |
| Dividend Option | ₹ 16.852 | ₹ 15.125 |
| Volatility | 22.09% |
| Beta: | 0.99 |
| R Squared | 0.97 |
| Sharpe Ratio#: | 0.17 |
| Information Ratio | 0.88 |
| Portfolio Turnover Ratio^ | 0.97 times |
@The Volatility, Beta, R Squared, Sharpe Ratio & Information Ratio are calculated on returns from last three years Monthly data points. # Risk free rate: FBIL OVERNIGHT MIBOR as on 31st August 2020.^Basis last rolling 12 months. |
|
| Portfolio Holdings | % Allocation |
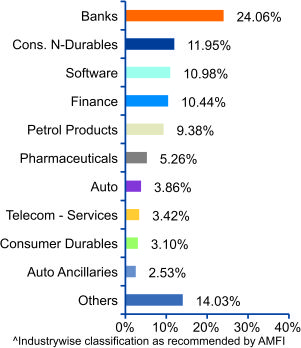
| Banks | |
| HDFC Bank Ltd | 9.60% |
| ICICI Bank Ltd | 6.25% |
| Axis Bank Ltd | 4.06% |
| State Bank of India | 2.56% |
| Kotak Mahindra Bank Ltd | 1.41% |
| IndusInd Bank Ltd | 0.19% |
| Consumer Non Durables | |
| ITC Ltd | 2.63% |
| Hindustan Unilever Ltd | 2.47% |
| Emami Ltd | 1.99% |
| Kansai Nerolac Paints Ltd | 1.88% |
| Dabur India Ltd | 1.08% |
| Tata Consumer Products Ltd | 1.07% |
| Jyothy Labs Ltd | 0.83% |
| Software | |
| Infosys Ltd | 5.95% |
| Tata Consultancy Services Ltd | 3.92% |
| MindTree Ltd | 1.11% |
| Finance | |
| Housing Development Finance Corporation Ltd | 2.28% |
| Max Financial Services Ltd | 2.12% |
| HDFC Life Insurance Company Ltd | 1.34% |
| Indian Energy Exchange Ltd | 1.24% |
| Power Finance Corporation Ltd | 1.22% |
| Cholamandalam Investment and Finance Company Ltd | 1.20% |
| SBI Life Insurance Company Ltd | 0.74% |
| IIFL Securities Ltd | 0.28% |
| SBI Cards and Payment Services Ltd | 0.00% |
| Petroleum Products | |
| Reliance Industries Ltd* | 6.75% |
| Bharat Petroleum Corporation Ltd | 1.60% |
| Hindustan Petroleum Corporation Ltd | 1.04% |
| Pharmaceuticals | |
| Dr. Reddy's Laboratories Ltd | 1.38% |
| Divi's Laboratories Ltd | 1.22% |
| Sun Pharmaceutical Industries Ltd | 1.21% |
| Natco Pharma Ltd | 0.74% |
| Lupin Ltd | 0.71% |
| Auto | |
| Maruti Suzuki India Ltd | 2.43% |
| Ashok Leyland Ltd | 1.43% |
| Telecom - Services | |
| Bharti Airtel Ltd | 3.42% |
| Consumer Durables | |
| Voltas Ltd | 1.94% |
| Havells India Ltd | 0.91% |
| Titan Company Ltd | 0.24% |
| Auto Ancillaries | |
| Balkrishna Industries Ltd | 1.48% |
| CEAT Ltd | 1.04% |
| Construction Project | |
| Larsen & Toubro Ltd | 2.52% |
| Gas | |
| Gujarat State Petronet Ltd | 1.58% |
| Power | |
| NTPC Ltd | 1.50% |
| Industrial Products | |
| Prince Pipes And Fittings Ltd | 1.39% |
| Industrial Capital Goods | |
| Bharat Electronics Ltd | 1.31% |
| Chemicals | |
| Vinati Organics Ltd | 1.17% |
| Cement | |
| JK Cement Ltd | 1.15% |
| Construction | |
| Kajaria Ceramics Ltd | 1.01% |
| Ferrous Metals | |
| Tata Steel Ltd | 0.67% |
| Textile Products | |
| Page Industries Ltd | 0.59% |
| Retailing | |
| Avenue Supermarts Ltd | 0.54% |
| Transportation | |
| Gateway Distriparks Ltd | 0.49% |
| Healthcare Services | |
| Dr. Lal Path Labs Ltd | 0.12% |
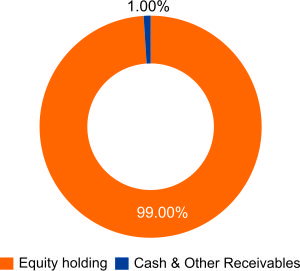
| Equity Holding Total | 99.00% |
| Cash & Other Receivables | 1.00% |
| Total | 100.00% |
*Includes "Partly Paid Shares"
| New Position Bought |
| Stock |
| Pharmaceuticals |
| Natco Pharma Limited |
| Positions Exited |
| Stock |
| Pharmaceuticals |
| Biocon Limited |
| Cement |
| Grasim Industries Limited |
| Software |
| Info Edge (India) Limited |
| Pharmaceuticals |
| Torrent Pharmaceuticals Limited |
| Positions Increased |
| Stock |
| Auto Ancillaries |
| CEAT Limited |
| Banks |
| HDFC Bank Limited |
| ICICI Bank Limited |
| Consumer Non Durables |
| Emami Limited |
| Hindustan Unilever Limited |
| Kansai Nerolac Paints Limited |
| Finance |
| HDFC Life Insurance Company Limited |
| Gas |
| Gujarat State Petronet Limited |
| Petroleum Products |
| Bharat Petroleum Corporation Limited |
| Pharmaceuticals |
| Divi's Laboratories Limited |
| Dr. Reddy's Laboratories Limited |
| Lupin Limited |
| Telecom - Services |
| Bharti Airtel Limited |
| Positions Decreased |
| Stock |
| Auto Ancillaries |
| Balkrishna Industries Limited |
| Banks |
| IndusInd Bank Limited |
| Kotak Mahindra Bank Limited |
| Construction Project |
| Larsen & Toubro Limited |
| Consumer Durables |
| Havells India Limited |
| Consumer Non Durables |
| Tata Consumer Products Limited |
| Finance |
| Cholamandalam Investment and Finance Company Limited |
| Indian Energy Exchange Limited |
| Max Financial Services Limited |
| Power Finance Corporation Limited |
| SBI Cards and Payment Services Limited |
| Industrial Capital Goods |
| Bharat Electronics Limited |
| Industrial Products |
| Prince Pipes And Fittings Limited |
| Petroleum Products |
| Reliance Industries Limited |
| Pharmaceuticals |
| Sun Pharmaceutical Industries Limited |
| Power |
| NTPC Limited |
| Transportation |
| Gateway Distriparks Limited |
| Record Date | Dividend (₹) | Face Value ( ₹) | Cum Nav ( ₹) |
06-Dec-18 |
0.50 per Unit |
10 |
14.618 |
16-Jan-20 |
0.95 per Unit |
10 |
16.328 |
Past Performance may or may not be sustained in future.
Pursuant to payment of dividend the NAV of the dividend option of the scheme will fall to the extent of payout and statutory levy (if any). Dividend history is for MATSF - Regular Plan - Dividend Option
| Returns (%) | ||||
| 1 Yr | 3 Yrs | SI | ||
| MATSF | 10.26 |
7.42 |
14.53 |
|
| Scheme Benchmark* | 4.46 |
4.29 |
8.94 |
|
| Additional Benchmark** | 4.60 |
8.04 |
10.23 |
|
| NAV as on 31st August, 2020 | 18.868 | |||
| Index Value (31st August, 2020) | Index Value of NIFTY 200 (TRI) is 7432.48 and S&P BSE Sensex (TRI) is 56932.37 | |||
| Allotment Date | 28th December, 2015 | |||
| Scheme Benchmark | **Nifty 200 (TRI)@ | |||
| Additional Benchmark | **S&P BSE Sensex (TRI) | |||
Note:1. Different Plans under the scheme has different expense structure. The reference and details provided herein are of Regular Plan - Growth Option
2. Fund manager : Mr. Neelesh Surana managing the scheme since 28th December, 2015
3. The scheme is in existence for more than 3 years and less than 5 years.
| Period | Total Amount Invested | Mkt Value as on 31-August-2020 |
SI |
560,000 |
729,024 |
3 Yrs |
360,000 |
405,695 |
1 Yr |
120,000 |
133,645 |
Returns (%) |
Period |
||
SI |
3yrs |
1yr |
|
Fund Return& (%) |
11.26 |
7.91 |
21.75 |
Benchmark Return& (%) |
6.48 |
3.45 |
13.72 |
Add. Benchmark Return& (%) |
8.84 |
6.23 |
13.78 |
& The SIP returns are calculated by XIRR approach assuming investment of ₹ 10,000/- on the 1st working day of every month.
This product is suitable for investors who are seeking*
• Growth of capital over long term
• Invests predominantly in equity and equity related instruments: ELSS with a 3 year lock in period & tax benefits
• Degree of risk – MODERATELY HIGH
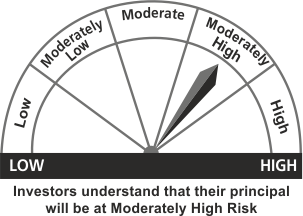
*Investors should consult their financial advisers if they are not clear about the suitability of the product.
Past Performance may or may not be sustained in future.
Note : For computation of since inception returns (%) the allotment NAV has been taken as ₹ 10.00. The performance of other funds managed by the same fund manager is given in the respective page of the schemes.