


SIP in Debt Funds
Investments through Systematic Investment Plans (SIP) were launched in India about 20 years back and have become one of the most popular investment vehicles for mutual funds. As per AMFI data, more than Rs 1 lakh Crores was
invested through SIP in Financial Year 2019-20. Around 93.25 lakh SIP accounts have been added so far in this fiscal year (31st December 2020), total SIP investments in the first three quarters of this fiscal year stood Rs 71,349
Crores.
However, mutual fund investors associate SIPs mostly with equity investments. In this article, we will discuss why SIPs can make sense for fixed income as well.
Fixed income and asset allocation
Different asset classes, e.g. fixed income, equity, gold etc. have different risk return characteristics. Equity is the most volatile asset class and has the potential of giving higher returns in the long term. Gold is less volatile than equity and can act as a hedge against inflation. However, Gold is more volatile than fixed income. Fixed income aims to reduce portfolio risks, provide stability and generate portfolio income.
Different asset classes outperform each other in different economic cycles. Equity and gold are usually counter-cyclical. Different asset classes also outperform each other in different economic cycles. Fixed income may outperform equity in bear markets, while equity may outperform fixed income in bull markets. Similarly gold and equity cycles are different. While equity outperforms fixed income in bull markets, fixed income outperforms in bear market.
The chart below shows the growth of Rs 10,000 investment in equity (represented by Nifty 50 TRI), fixed income (represented by Nifty 10 year Benchmark G-Sec Index) and gold over the last 10 years ending 31st December 2020. You can see that fixed income outperformed both equity and gold over fairly long periods. Diversifying across asset classes reduces volatility and brings stability to your portfolio.
Growth of Rs 10,000 in Nifty 50 TRI, Nifty 10 year G-Sec Index and Gold
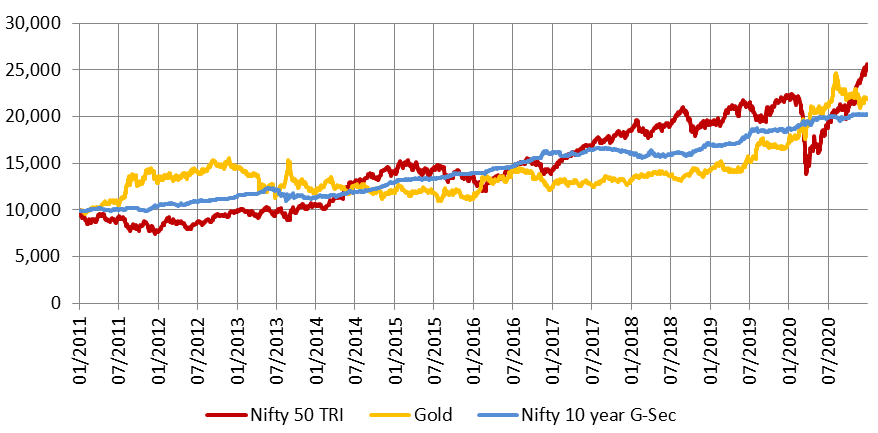
Source: National Stock Exchange, Advisorkhoj Research (Period 01.01.2011 to 31.12.2020). Disclaimer: Past performance may or may not be sustained in the future.
This line chart compares the growth of N rises from approximately 9,000 to more than 25,000, delivering the highest return. Gold fluctuates considerably, ending near 22,000. The Nifty 10 Year G-Sec line grows steadily from approximately 10,000 to 20,000. The chart indicates that equity investments generated higher long-term returns than gold and government securities during the period shown.
SIPs in debt funds can generate relatively good returns
SIPs in debt funds can generate relatively good returns over long investment tenures. The chart below shows the growth of Rs 10,000 monthly SIP in Nifty 10 year G-Sec Index over the last 10 years ending 31st December 2020. The annualised SIP return (XIRR) over this period was 7.7%.
Though SIP in debt funds may be a relatively new concept for many investors, most investors are familiar with another form of systematic investment in fixed income – bank recurring deposit (RD). The chart below shows how monthly SIP in Nifty 10 year G-Sec Index outperformed same monthly investment through recurring deposits (RD). The XIRR of monthly recurring deposits over the last 10 years was 7% compared to 7.7% XIRR for Nifty 10 year G-Sec Index.
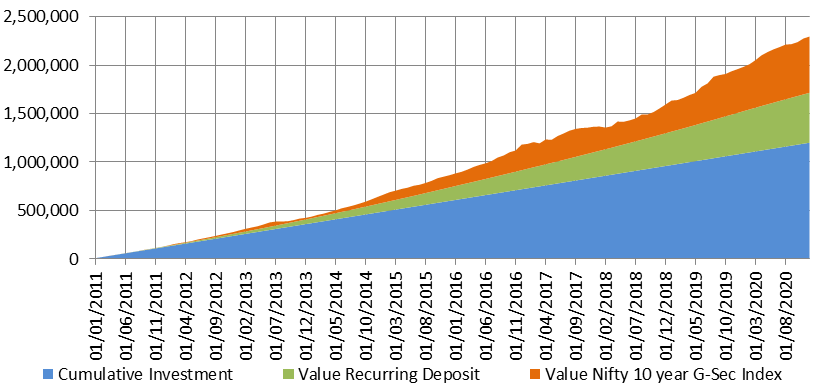
Source: National Stock Exchange, SBI Quarterly FD rates (Recurring Deposit), Advisorkhoj Research (Period 01.01.2011 to 31.12.2020). Disclaimer: Past performance may or may not be sustained in the future.
The chart shows investment growth from January 2011 to August 2020. The blue area represents cumulative investment, increasing steadily to approximately ₹12 lakh. The green area represents recurring deposit value, growing to approximately ₹17 lakh when combined with cumulative investment. The orange area represents additional value generated by the Nifty 10 Year G-Sec Index, bringing the total value to approximately ₹23 lakh by August 2020. The chart demonstrates that the Nifty 10 Year G-Sec Index contributed significant growth over the investment period.
SIP in fixed income can also benefit volatility
SIPs take advantage of volatility through the Rupee Cost Averaging of purchase price. Investor usually associate volatility with equity investments but fixed income can also be volatile due to changes in interest rate (yields) and credit spreads. See the chart below which shows change in yields of 10 year Government Bond (10 year G-Sec), 10 year AAA rated corporate bond and 10 year AA rated corporate bond over the last 5 years (ending 31st December 2020). Longer the duration of a debt fund, higher is the price volatility of the fund due to change in bond yields.
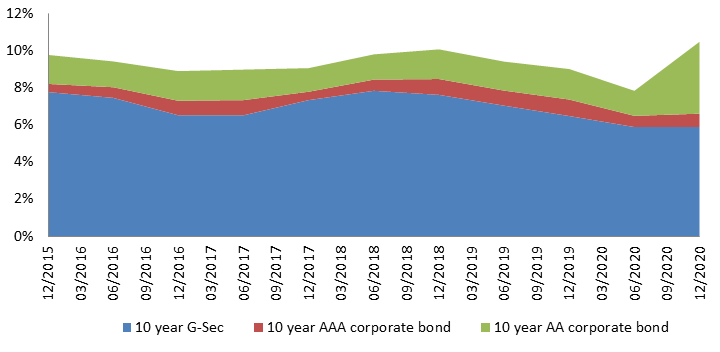
Source: RBI, CRISIL, Advisorkhoj Research (Period 31.12.2015 to 31.12.2020). Disclaimer: Past performance may or may not be sustained in the future.
Stacked area chart showing the allocation percentages of three fixed income asset classes from December 2015 to December 2020. The 10 year G-Sec allocation remains the largest component throughout the period, generally ranging between 6% and 8%. The 10 year AAA corporate bond allocation remains relatively stable at around 0.5% to 1%. The 10 year AA corporate bond allocation fluctuates between approximately 1% and 4%, with a noticeable increase toward December 2020. The combined allocation remains between approximately 8% and 10.5% over most of the period.
Why invest in debt funds through SIP?
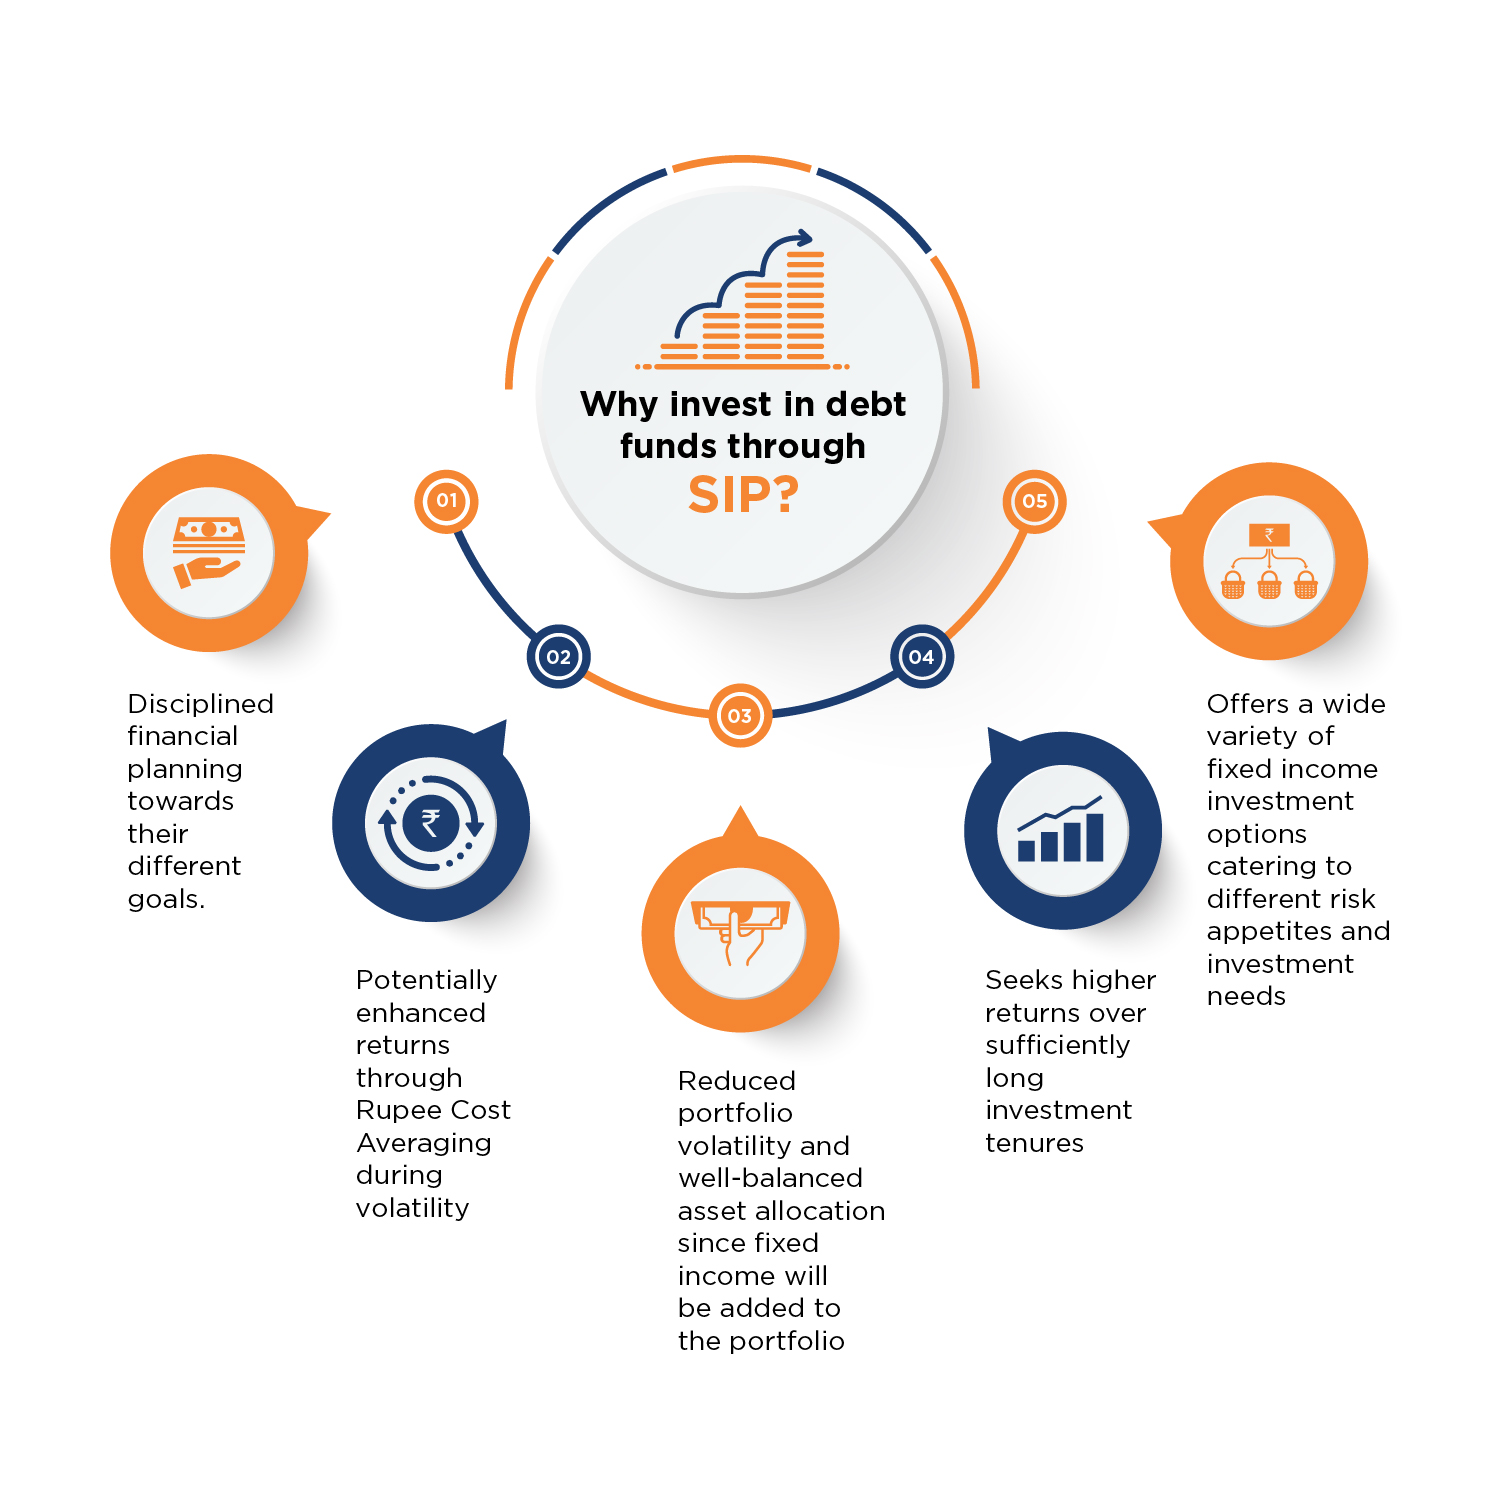
Infographic explaining the benefits of investing in debt funds through a Systematic Investment Plan (SIP). The benefits include disciplined financial planning towards different goals, potentially enhanced returns through rupee cost averaging during market volatility, reduced portfolio volatility and improved asset allocation through the addition of fixed income investments, the potential for higher returns over longer investment horizons, and access to a wide variety of fixed income investment options catering to different risk appetites and investment needs.
Taxation Advantage
This is another reason why you should invest in debt funds through SIPs, we think that this deserves special mention because this is significant advantage which SIPs in debt funds enjoy over traditional investment options like bank RD. Debt funds are more tax efficient than bank RDs. While bank RD interest is taxed during the tenure of your investment at the income tax rate of the investor, debt fund returns for growth options are taxed only on redemption and long term investors (3 years plus tenures) can avail of indexation benefits.
Long term capital gains in debt funds are taxed at 20% after allowing for indexation benefits and therefore, offer significant tax benefits for investors in the higher tax brackets. Debt fund SIP investors however, should note that you can avail long term capital gains tax benefits only for SIP instalments that have completed 3 years from the date of instalment.
Which debt funds are suitable for SIP?
All debt funds are not suitable for SIPs. You need to have long investment tenures because SIP returns are highest in the long term due to the power of compounding. Debt funds which have higher volatility and need long investment horizons should be considered for SIPs. The table below can help you decide, which category of debt funds you can consider for investing through the SIP route. You should always consult with your financial advisor to help you select the right scheme according to your needs.
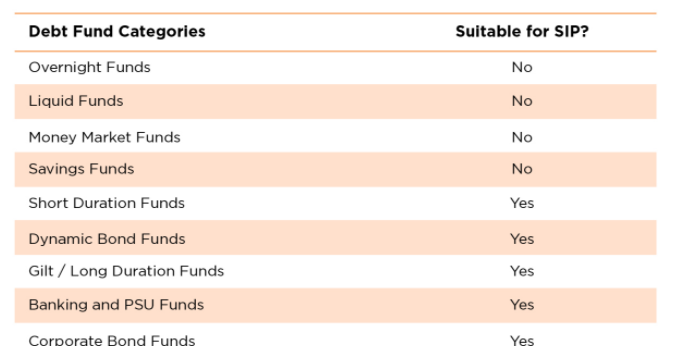
Table listing debt fund categories and their suitability for Systematic Investment Plans (SIPs). Overnight Funds, Liquid Funds, Money Market Funds, and Savings Funds are marked as not suitable for SIPs. Short Duration Funds, Dynamic Bond Funds, Gilt or Long Duration Funds, Banking and PSU Funds, and Corporate Bond Funds are marked as suitable for SIPs.
How to Choose Debt Funds for SIP
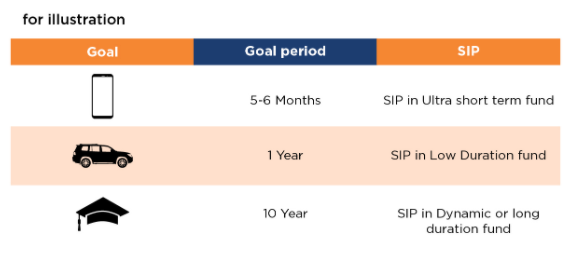
Table showing examples of investment goals, corresponding goal periods, and suitable debt fund SIP options. A goal with a time horizon of 5 to 6 months is associated with an SIP in an Ultra Short Term Fund. A goal with a time horizon of 1 year is associated with an SIP in a Low Duration Fund. A goal with a time horizon of 10 years is associated with an SIP in a Dynamic Bond Fund or Long Duration Fund.
Articles

SIP in Debt Mutual Funds
By investing a fixed amount every month (or any other interval) from your regular savings, you can invest over a long period of time and benefit from the power of compounding.
Read MoreVideos
For information on one-time KYC (Know Your Customer) process, Registered Mutual Funds and procedure to lodge a complaint in case of any grievance Click here!
Mutual Fund investments are subject to market risks, read all scheme related documents carefully.