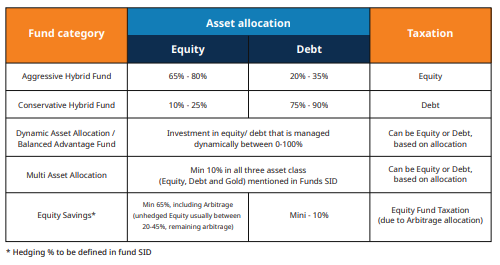
The image is a table comparing fund categories based on asset allocation and taxation treatment. The table has three columns: Fund Category, Asset Allocation, and Taxation. Aggressive Hybrid Funds typically allocate 65% to 80% of assets to equity and 20% to 35% to debt and are taxed as equity-oriented funds. Conservative Hybrid Funds typically allocate 10% to 25% to equity and 75% to 90% to debt and are taxed as debt-oriented funds. Dynamic Asset Allocation or Balanced Advantage Funds invest in equity and debt, with allocations adjusted dynamically between 0% and 100% depending on market conditions. Their taxation may be treated as either equity or debt, depending on the portfolio allocation. Multi Asset Allocation Funds maintain a minimum allocation of 10% each to equity, debt, and gold, as defined in the fund's Scheme Information Document (SID). Their taxation may be treated as either equity or debt, depending on the allocation structure. Equity Savings Funds maintain a minimum 65% allocation to equity, including arbitrage positions, with unhedged equity exposure typically ranging from 20% to 45% and the remainder invested in arbitrage strategies. Debt allocation is generally kept at a minimum of 10%. These funds receive equity fund taxation due to their arbitrage allocation. The table illustrates how different hybrid and allocation-based mutual fund categories vary in their mix of equity and debt investments and how that allocation influences their tax treatment.
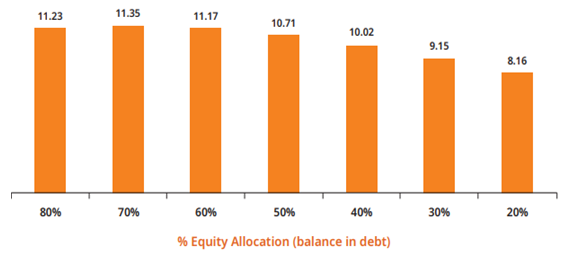
Let us take an example to show market value (at the end of 2019) of Rs 1 lakh investment made in 1998 for different asset allocations with annual asset allocation rebalancing to the target asset mix. You can see that the maximum wealth creation has taken place in 70% equity and 30% debt asset mix.
Source: Advisorkhoj, 31st December 2019 (Nifty 50 as the proxy for equity and Nifty 10 year G-Sec Index as the proxy for debt.)
The image is a bar chart showing the relationship between equity allocation and returns. The horizontal axis represents the percentage of equity allocation, with the remaining allocation invested in debt. Categories range from 80% equity and 20% debt on the left to 20% equity and 80% debt on the right. The chart displays the following return values for each allocation: 11.23% for 80% equity, 11.35% for 70% equity, 11.17% for 60% equity, 10.71% for 50% equity, 10.02% for 40% equity, 9.15% for 30% equity, and 8.16% for 20% equity. Returns are highest at the 70% equity allocation level and generally decline as the proportion of equity decreases and the proportion of debt increases. The chart illustrates that portfolios with higher equity exposure historically generated higher returns than portfolios with lower equity exposure, although the increase in returns is not proportional across all allocation levels.
An Investor Education and Awareness Initiative by Mirae Asset Mutual Fund. All Mutual Fund investors have to go through a one-time KYC (Know Your Customer) including the process for change in address, Phone number, bank details, etc. Investors should deal only with registered Mutual Funds details of which can be verified on SEBI website (https://www.sebi.gov.in) under ‘Intermediaries /Market Infrastructure Institutions’. For further information on KYC, RMFs and procedure to lodge a complaint in case of any grievance, you may refer the Knowledge Centre section available on the website of Mirae Asset Mutual Fund. Investors may lodge complaints on https://www.scores.gov.in against registered intermediaries if they are unsatisfied with the responses. SCORES facilitate you to lodge your complaint online with SEBI and subsequently view its status.
Mutual Fund investments are subject to market risks, read all scheme related documents carefully.

 ETF Website